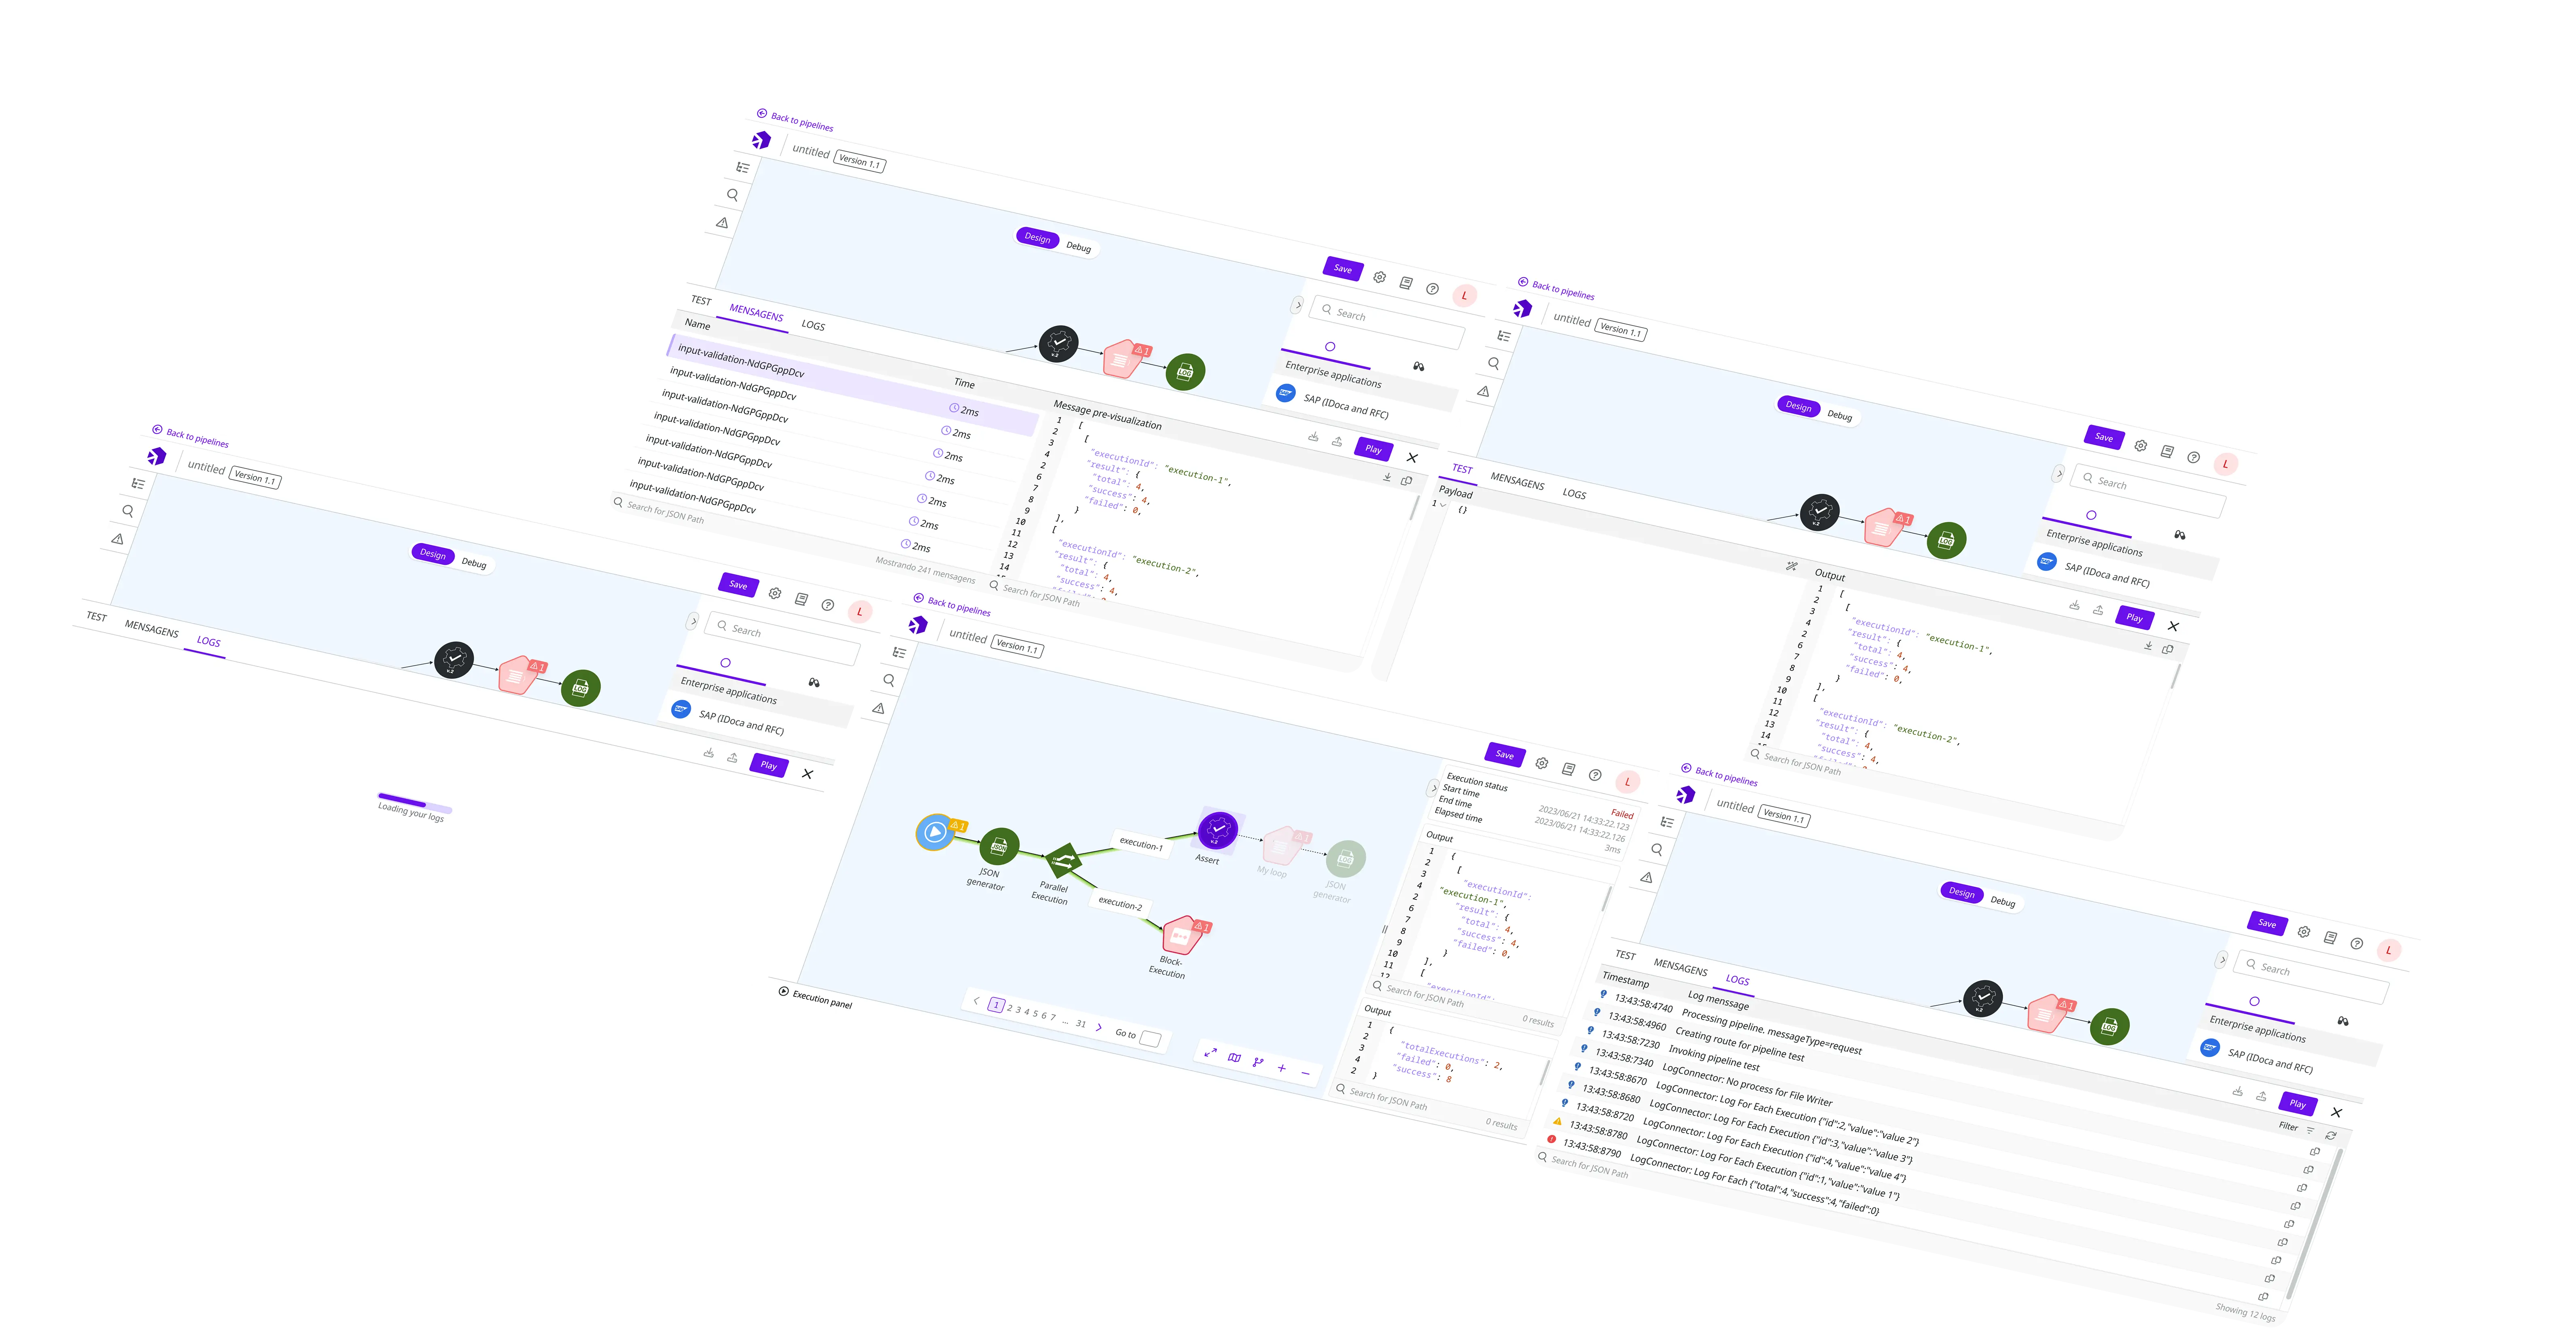
- Canvas
- Low-code
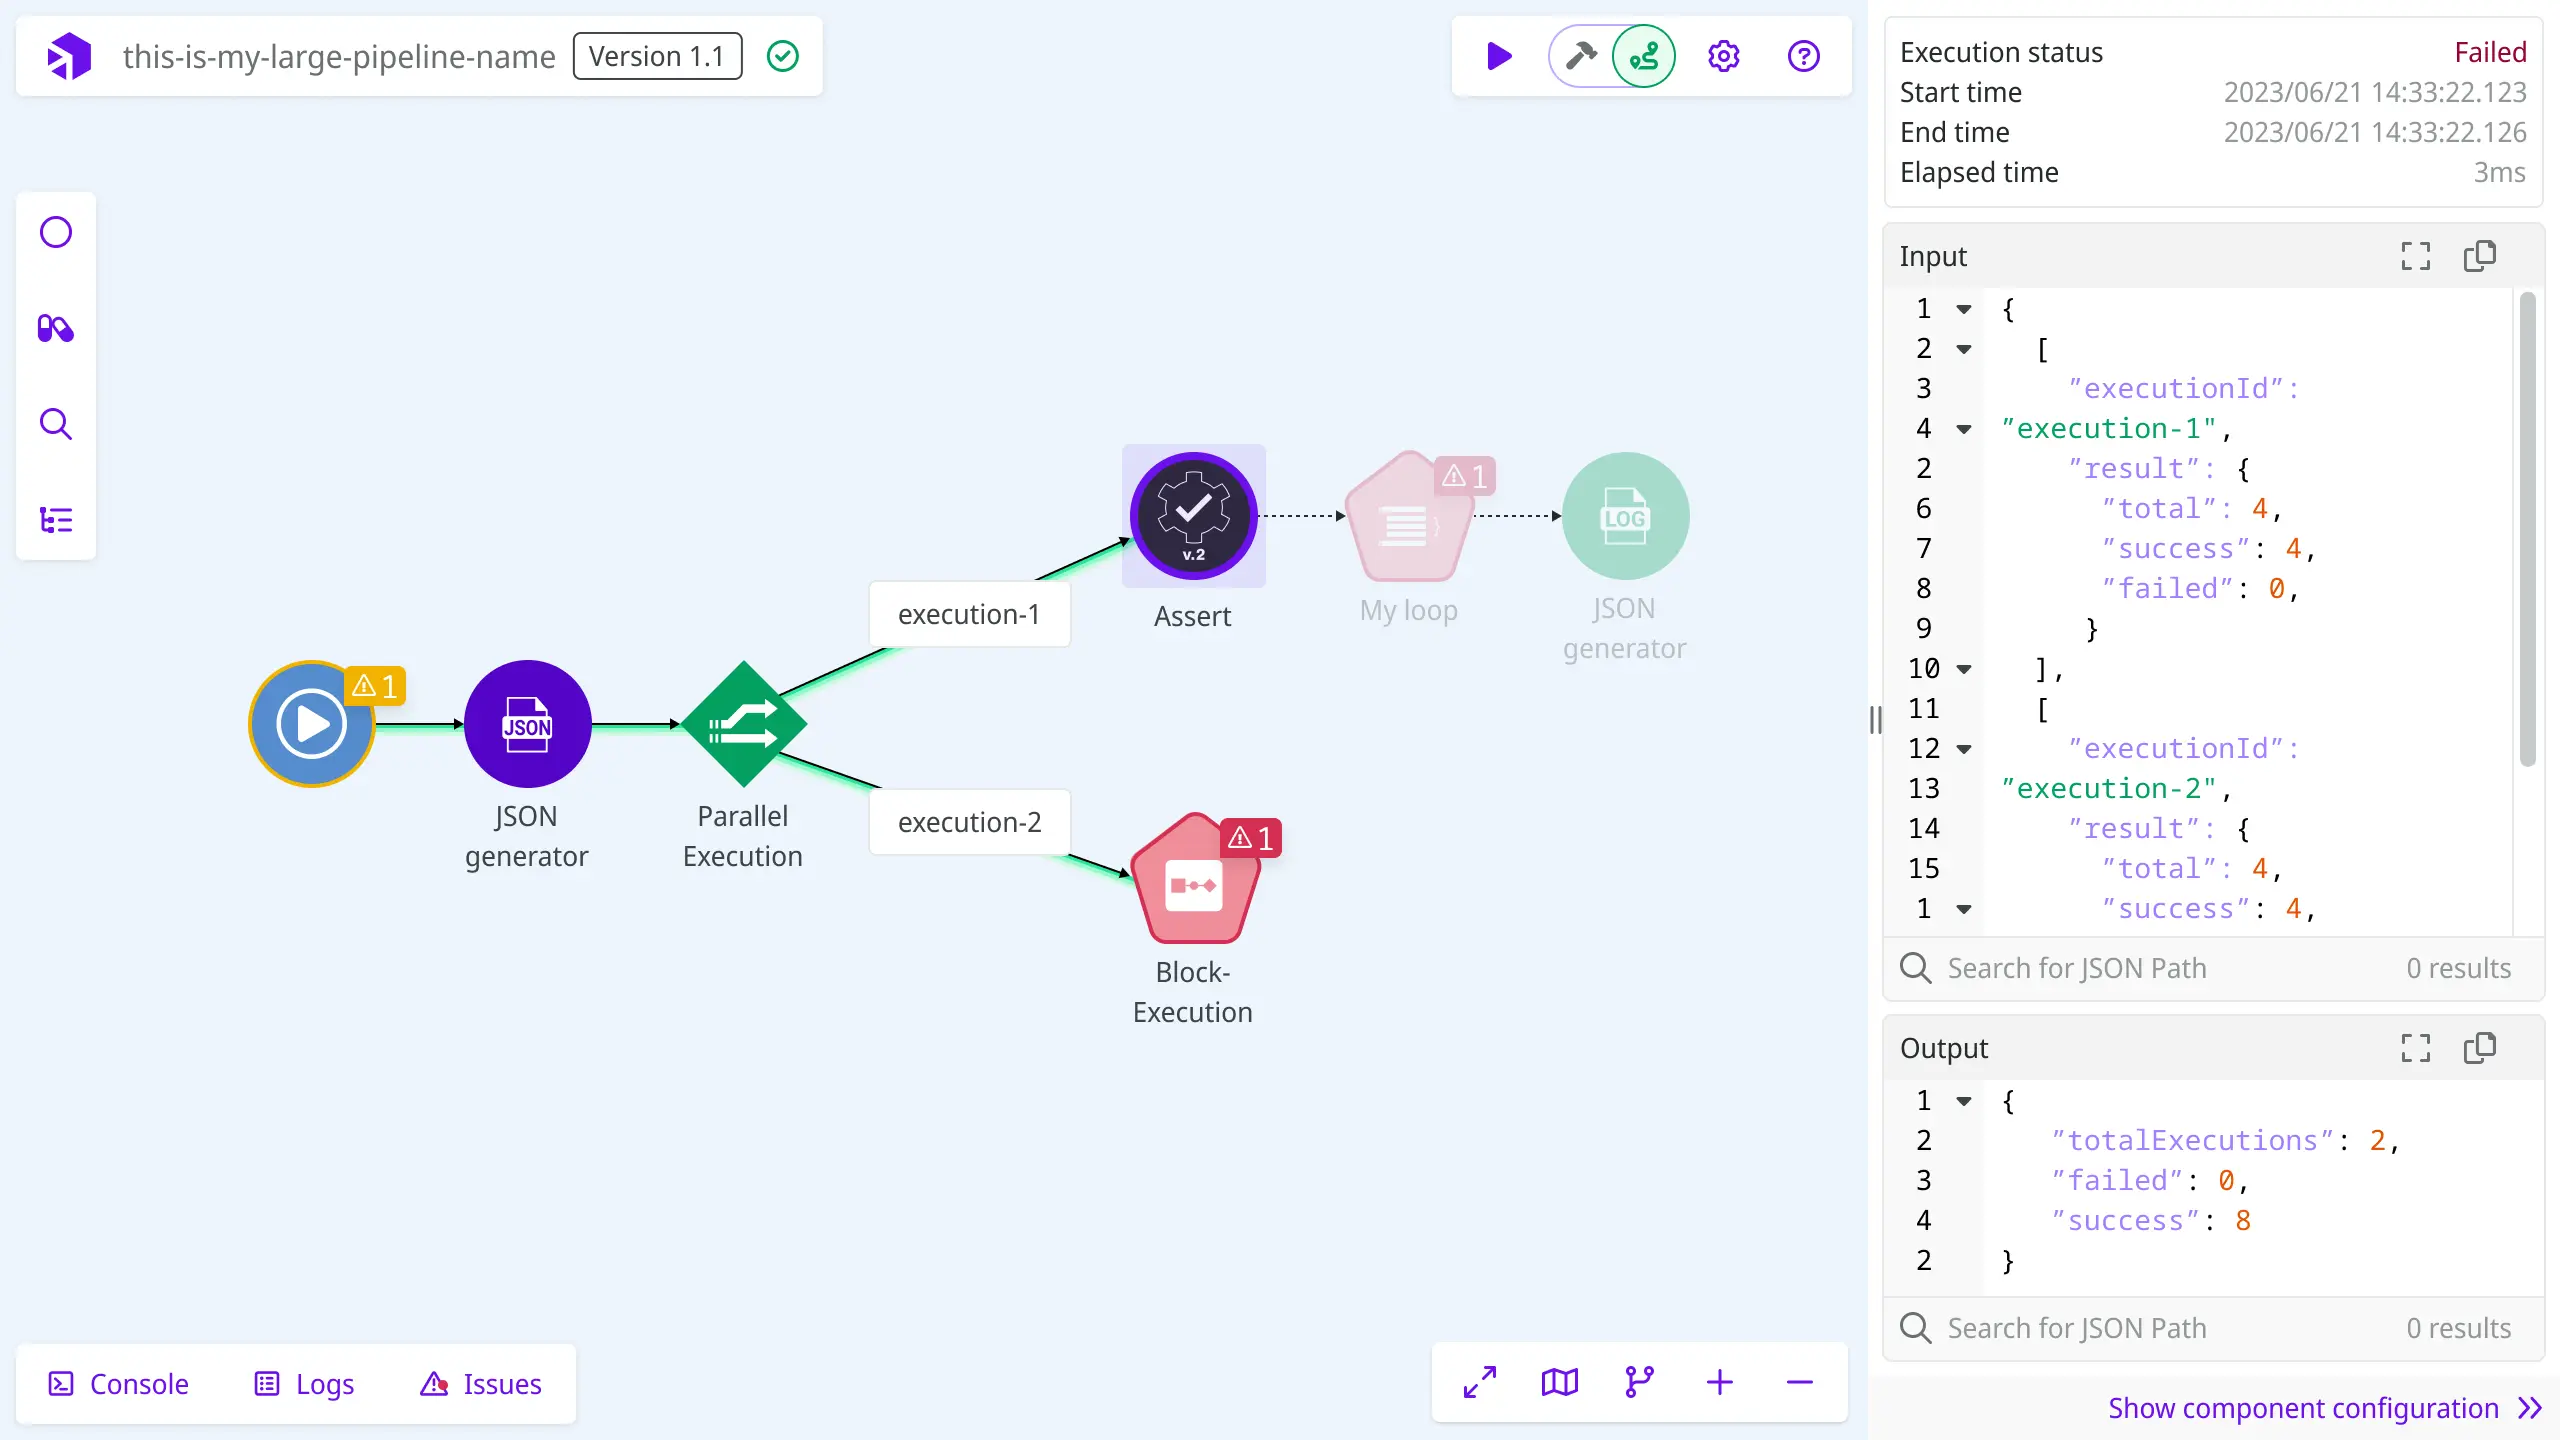
- Visual Debugger
Achieved a 40% reduction in test executions per session via a new debugging feature, concurrently saving 23% in cloud infrastructure operational costs.
Cost savings
Cut operational costs for cloud infrastructure
by 23% in test execution
scope, significantly impacting one of our platform's
most frequently used features.
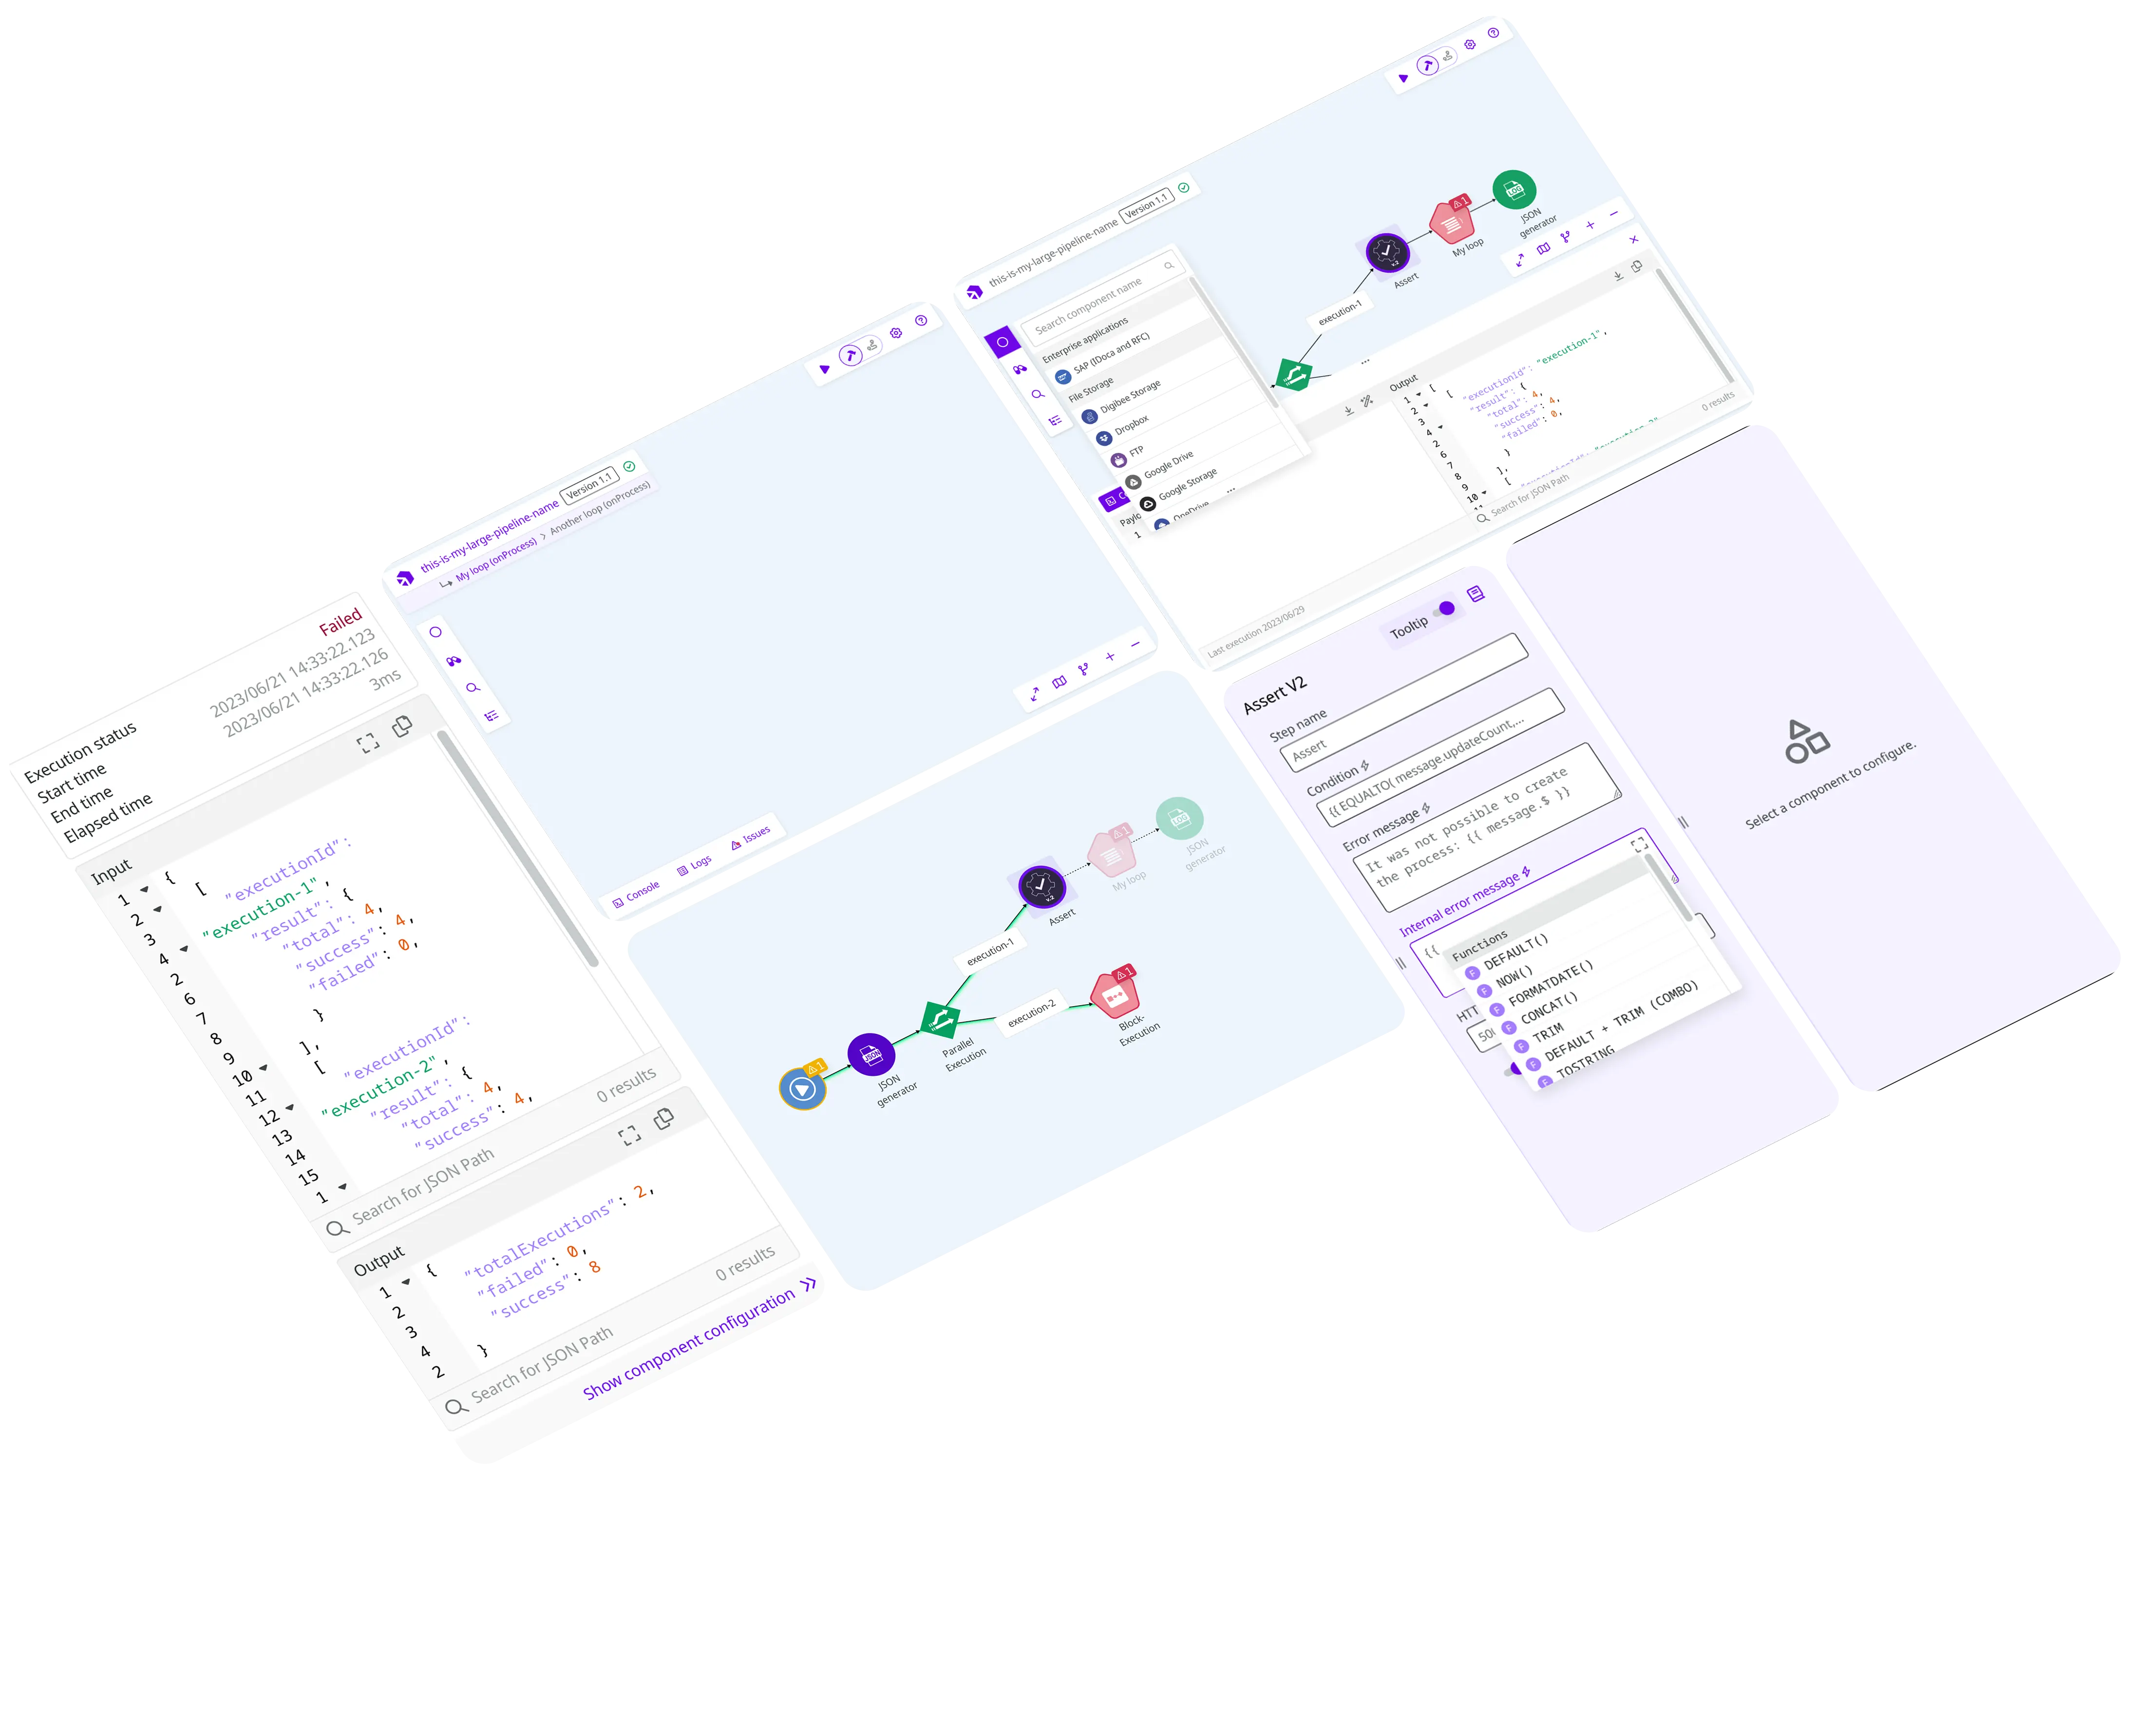
Insights
Decisions
Competitive analysis showed...
- Weak iteration functionality
- Manual step-through, as in traditional high-code
- Poor fit for low-code and SaaS environments
Stakeholder interview told us...
- Difficult to see data in and out of flow components
- Current methods break workflows and require workarounds
- Users lack integrated tools for data comparison and validation
Reduced Friction
Reduced test executions clicks
by 40% per session,
raising user productivity
up to 28%
User quotes
Seeing the data directly through the flow has been a huge help. It's actually made my flows a lot more compact too, because I'm not stuck adding a ton of Assert connectors just to figure out what's going on.
- AssaíNo more stitching my flow!
- BauduccoYou have no clue how much time this will save me
- Digibee consultantCompetitive edge
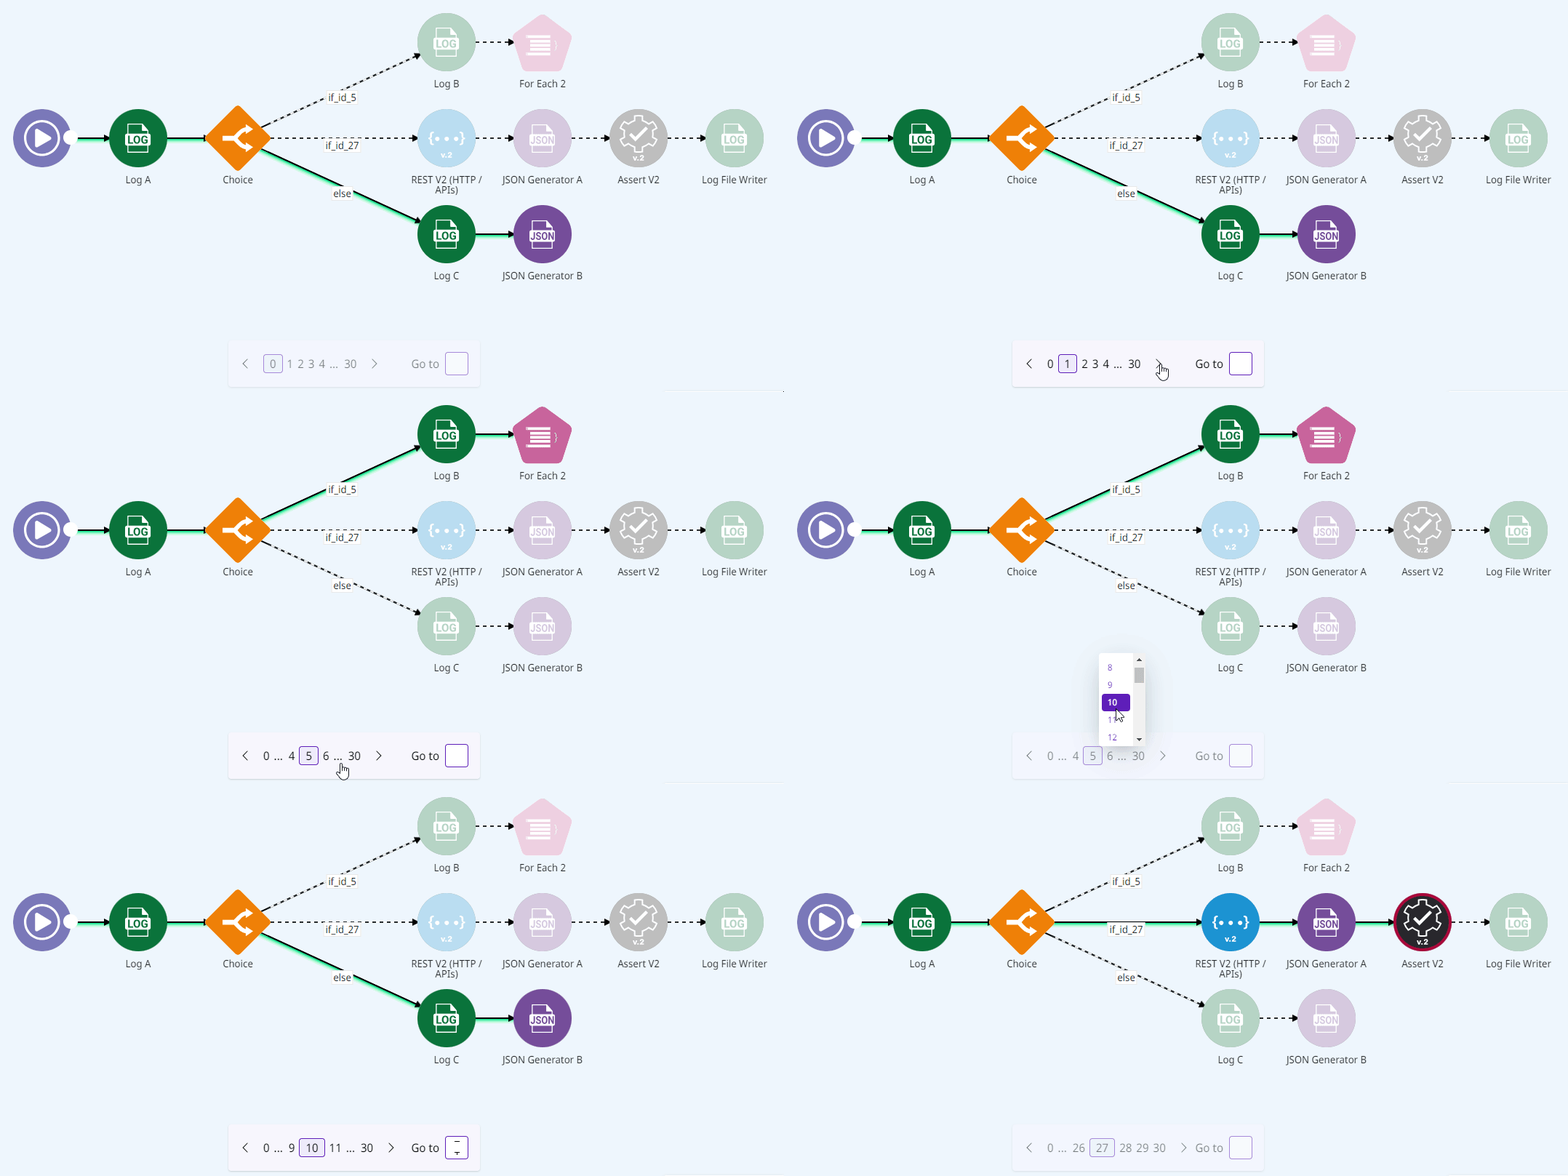
Innovative visual debugger that utilizes existing
execution data, providing a
non-disruptive way to
understand flow logic, including halts and
sub-processes, a feature
unmatched in the market.